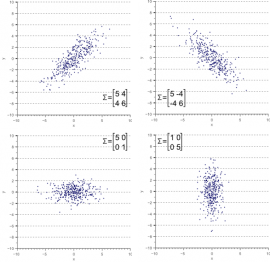
In this article, we provide an intuitive, geometric interpretation of the covariance matrix, by exploring the relation between linear transformations and the resulting data covariance. Most textbooks explain the shape of data based on the concept of covariance matrices. Instead, we take a backwards approach and explain the...
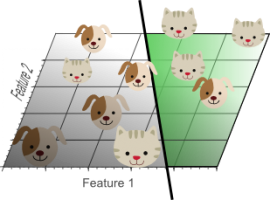
Continue reading » April 24, 2014 Vincent SpruytLinear algebra47 Comments In this article, we will discuss the so called ‘Curse of Dimensionality’, and explain why it is important when designing a classifier. In the following sections I will provide an intuitive explanation of this concept, illustrated by a clear example of overfitting due to the curse of dimensionality....
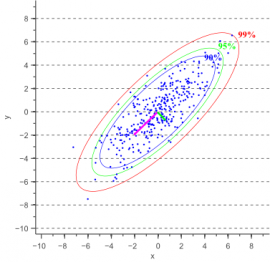
Continue reading » April 16, 2014 Vincent SpruytFeature extraction52 Comments In this post, I will show how to draw an error ellipse, a.k.a. confidence ellipse, for 2D normally distributed data. The error ellipse represents an iso-contour of the Gaussian distribution, and allows you to visualize a 2D confidence interval. The following figure shows a 95% confidence ellipse for...
Continue reading » April 3, 2014 Vincent SpruytStatistics62 Comments